1. Introduction
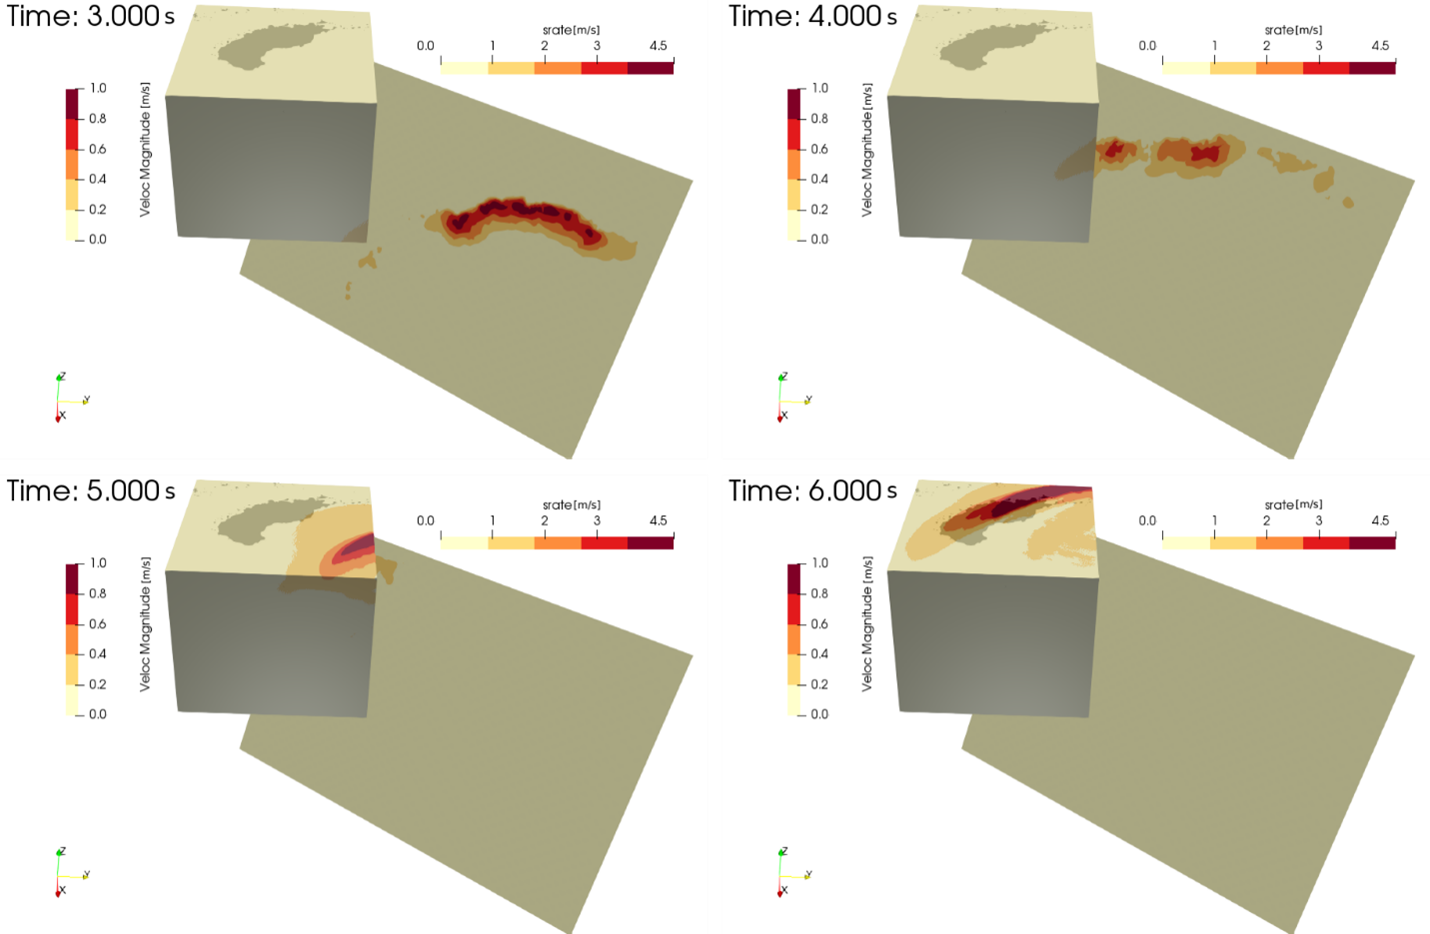
SEM3D is a high-fidelity software that solves the 3D elastodynamic (and acoustic) problem by means of the spectral element method (SEM) on linear and quadratic hexahedral finite elements. The SEM leverages a high-order polynomial approximation to achieve high accuracy of the numerical approximation. SEM3D is widely adopted as and earthquake simulator engine. It is tailored to predict 3D seismic wave field characterizing complex earthquake scenarios, from the fault to the site of interest, typically within regions 100 km x 100 km large (see Figure 1).

Figure 1: snapshots of a SEM3D simulation of the Argostoli (Touhami et al.2022) 1.3 · 1010 dofs ; 0-10 Hz Argostoli earthquake [5]. ≈20 h wall-time - 4000 MPI cores @Occigen (3333 days CPU time)
SEM3D development started more than 10 years ago, and it has been co-developed by:
- Institut de Physique du Globe de Paris
- Commissariat à l'énergie atomique et aux énergies alternatives
- CentraleSupélec
- Centre national de la recherche scientifique.
SEM3D source code can be found here (Touhami 2022).
Along the years, SEM3D has been thoroughly optimized to take advantage of modern supercomputers and it has been extensively tested on French national supercomputers (TIER1) such as CINES Occigen and IDRIS Jean-Zay. In particular, the major efforts were devoted to:
- achieve explicit vectorization (up to AVX 512).
- prove weak and strong scalability up to and beyond 4 096 cores.
- Develop parallel HDF5 I/O.
This document presents the results of the SEM3D benchmark on GCP’s AMD instances. As the Intel’s compiler is widely used in HPC environment, we also wanted to see how AMD’s Compiler behaves performance-wise compared to Intel’s.
The purpose of this study is to:
- Observe and understand the behavior of SEM3D and compare Intel Compilers (ICC) and AMD Optimizing C/C++ and Fortran Compilers (AOCC) performance on GCP’s AMD instances.
- Show SEM3D performance and scalability on AMD-based virtual machine (VM) solution on GCP.
After a brief description of the application and of the instances, the methodology and the runs will be described. The analysis of the results will then be provided.
2. Benchmark description
This section outlines the technical approach followed for the present benchmark, starting with a brief description of the two test cases. It also outlines the infrastructure in place and the compilers used for this work.
2.1 Test cases
The most common approach adopted to benchmark HPC software is to test its weak and strong scalability. In both cases, we compare the performances achieved with different number of compute nodes. In the strong scalability case, the same problem is used for all measures. In the weak scalability case, as we double the number of nodes, the size of the problem is also doubled.
In this work we adopted a polynomial order 4, corresponding to 5 Gauss–Lobatto–Legendre (GLL) integration points per direction, for a total of 125 GLL points per hexahedron.
2.1.1 Weak Scalability
The first use case consists of a simple 1200 m x 1200 m x 1500 m parallelepiped domain. It was used to study the weak scalability where the CPU workload remains constant with a practical value of 32k elements and a simulation time of 0.1 second.
Weak scalability runs were performed from 1 up to 900 cores.
2.1.2 Strong Scalability
A second, more realistic, model based on 1256000 elements, was used for the strong scalability analysis.
A simulation time of 0.5 second was used for all the runs starting from 112 (one node) up to 4032 cores (36 nodes).
2.2 Cloud Architecture
A collection of bash scripts has been developed to manage the process. Those scripts start an instance group of requiring number of nodes, set up the environment, perform the calculation, and destroy the group. Scripts that manage the infrastructure are based on a gcloud tool.
The startup script basically sets up the ssh key and installs packages.
After that, the first node mounts the persistent disk, which is used to store the input and the application and exports, using NFS to make it accessible to other nodes. These other nodes then perform the NFS mount. Following this, the job is initiated, and the results are collected.
Once all the runs are completed, the output data is retrieved, and the post-processing scripts are executed.
2.2.1 Instance Description
The instances used in this work are c2d-standard-112.
This compute-optimized instance type is based on the 3rd Gen AMD EPYCTM processor, comprises 112 vCPUs, and has a capacity of 896GB of memory and a default output bandwidth of 32 Gbps.
2.3 Compilers and libraries
The application was initially built for Intel processors and has been thoroughly tested with the Intel compiler and libraries. In this study, our aim was to assess the ease of porting a code from Intel’s suite to AMD’s and compare the performances of the two architectures. We built SEMD3D and compared the performances obtained with these two configurations.
SEM3D depends on HDF5, thus, to be consistent the latter was also compiled as part of this project. HDF5 version 1.14.0 was used.
2.3.1 Intel compiler:
The Intel suite is composed of the three following items:
- Intel oneAPI compiler version 2023.2.0: the core of the compiler
- MKL version 2023.0.2: the mathematical libraries
- Intel MPI version 2023.2.0: the Intel MPI implementation
Below is how HDF5 was built with Intel compiler:
./opt/intel/oneapi/setvars.sh
export CC=icc
export F9X=ifort
export FC=ifort
export CXX=icpc
./configure --prefix=${build} --enable-fortran --enable-cxx --enable-shared
make
make install
2.3.2 AMD Optimizing C/C++ and Fortran Compilers
This study used the following three items:
- AOCC version 4.0.0: the compiler
- AOCL version 4.0: the mathematical library
- OpenMPI version 4.1.4: the MPI implementation
Below is how HDF5 was built with AOCC compiler:
/opt/AMD/aocc-compiler-4.0.0/setenv_AOCC.sh
export CC=clang
export F9X=flang
export FC=flang
export CXX=clang++
export FCFLAGS='-fPIC'
./configure --prefix=${build} --enable-fortran --enable-cxx --enable-shared
sed -i 's/wl=""/wl="-Wl,"/' libtool
3. Results and Analysis
Test results are shown below. They consist of plotting the core computation in the problem-solving process per iteration as a function of number of cores for SEM3D binaries compiled with Intel and AOCC compilers.
Weak scalability refers to a scenario where the problem size scales with the number of cores.
On the other hand, for strong scalability, the problem sizes are kept constant as the number of processors increases.
3.1 Weak Scalability Scenario
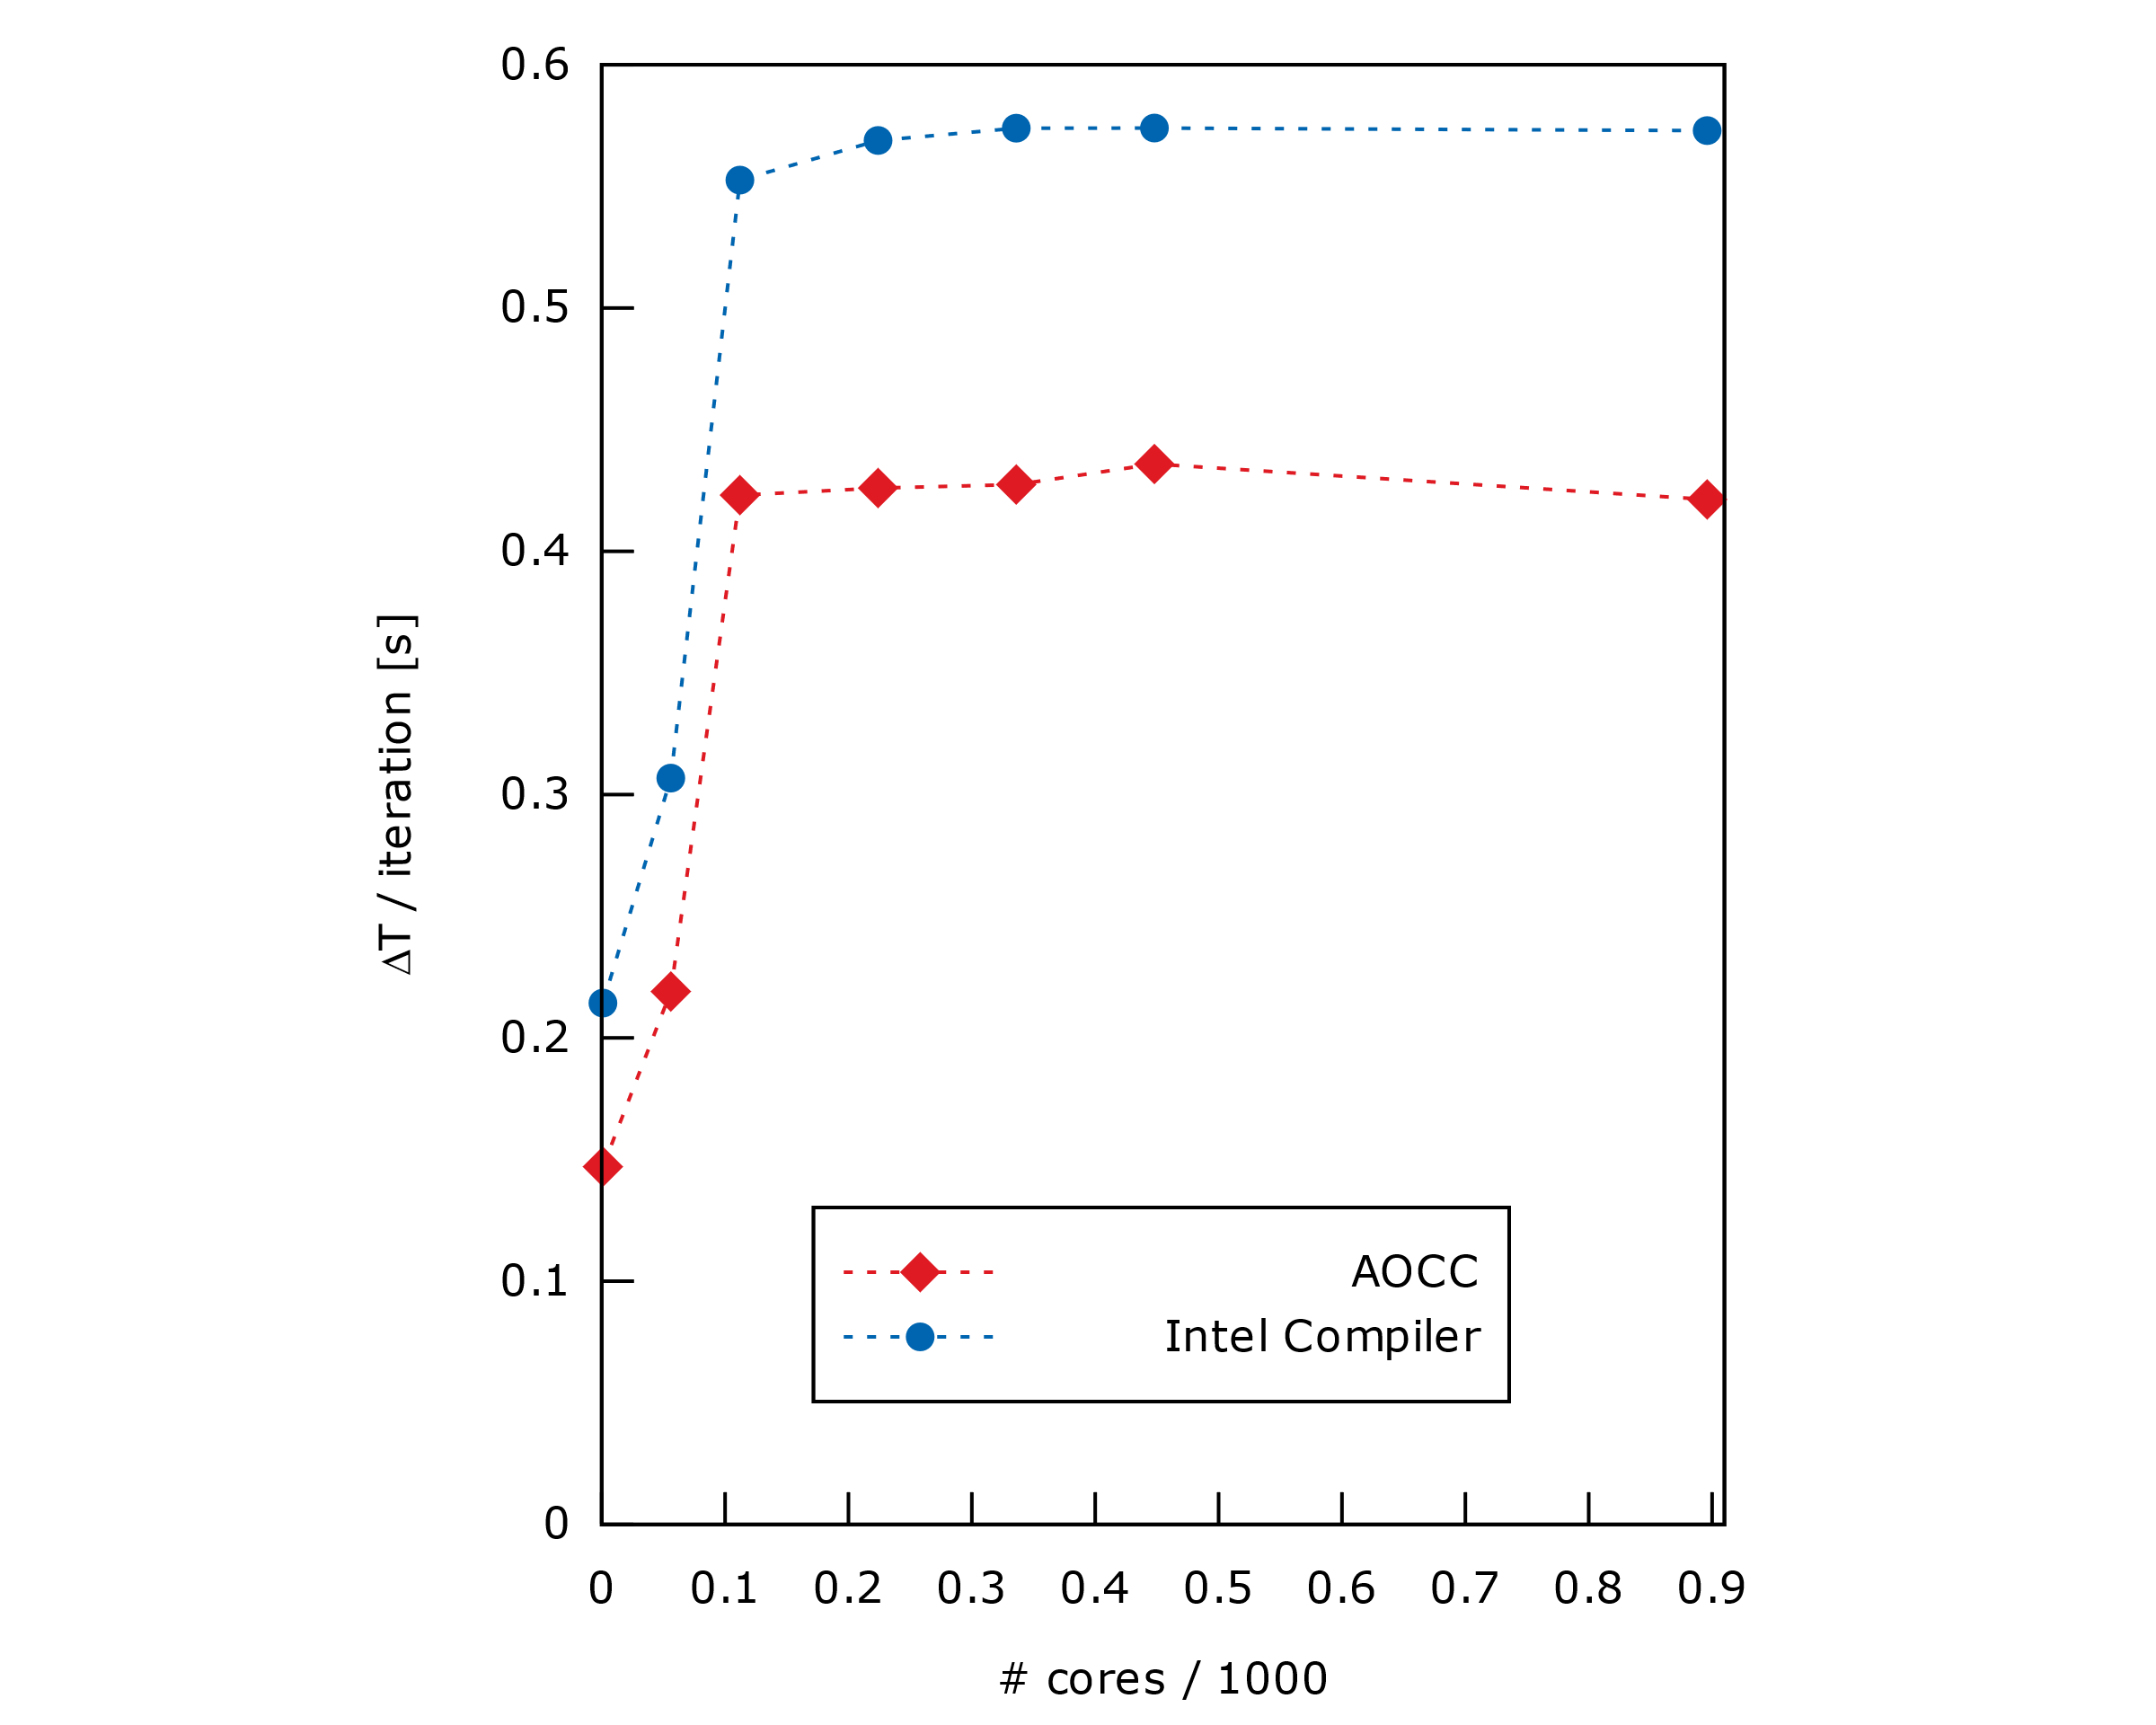
First, figure 2 highlights the difference of performance between Intel and AOCC compilers. Indeed, we can see that, for this test case, AOCC is between x1.30 and x1.36 more performant.
Then, Figure 2 also shows that both compilers exhibit the same behavior. Computation time remains constant across multiple nodes whereas using less than a full node increases the computer time. This may indicate an overhead like inter-processor communication, load balancing issues, or the fact that caching is not fully used.
However, the former suggests that the run time of the application remains constant, as both the system size and problem size increase proportionally.
 Figure 2. Weak Scalability for Intel and AOCC compilers (lower is better). The y-axis represents the total execution time divided by the number of iterations.
This indicates that SEM3D is efficiently using the increased computing resources to handle the larger problem size, keeping the time to solution steady.
In other words, since the computing cost depends on the size, this means that with a constant number of elements per CPU, the simulation price is proportional to the required precision.
3.2 Strong Scalability Scenario
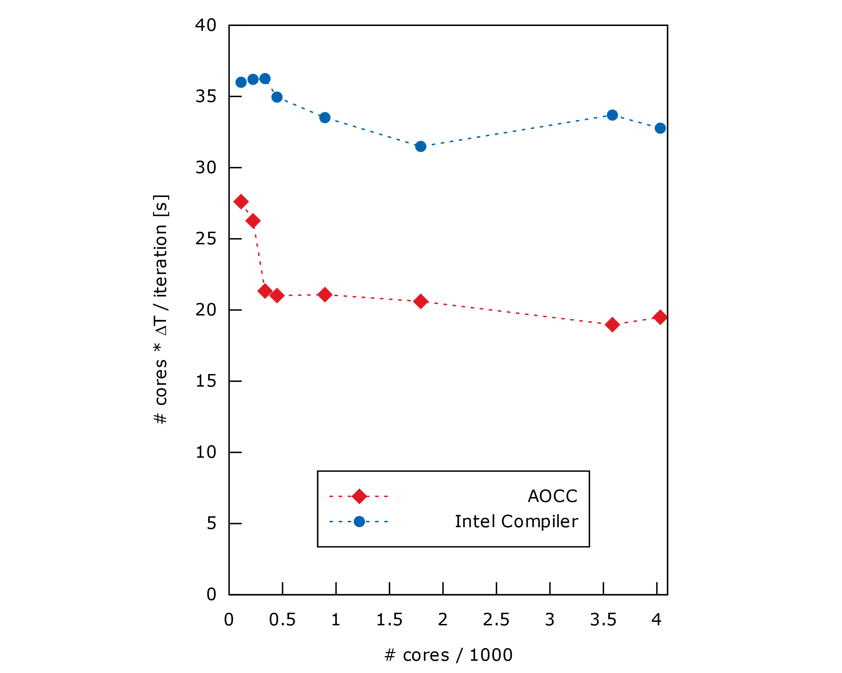
Figure 3 represents the key computation in the problem-solving process per iteration, multiplied by the number of cores, as function of number of cores.
Like the first system, AOCC is about x1.67 more performant.
Also, results show a constant behavior when using several nodes.
 Figure 3. Strong Scalability for Intel and AOCC compilers (lower is better). The y-axis represents the total execution time divided by the number of iterations times the number of cores.
Since the computational cost depends on the number of CPUs requested for the simulation, we see that simulation cost remains constant as the number of cores scales up. In practice, this enables users to get much faster results without increasing the resource consumption, be it energy or money.
4.Conclusion and perspectives
5. Bibliography
This document is the property of Aneo and may not be distributed to third parties without the written consent of Aneo


